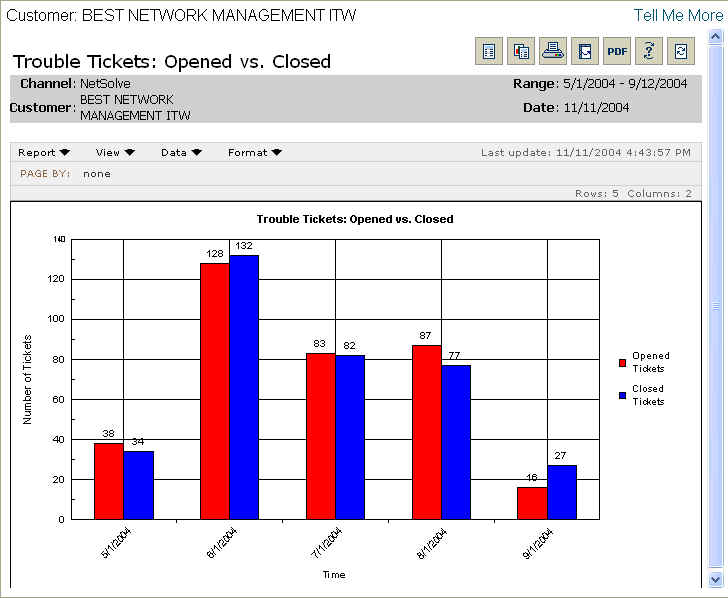
The Trouble Tickets: Opened vs. Closed report shows you the volume of tickets opened and closed over a specified period of time. You can use this report to see if we are opening more tickets than we are closing, thereby creating a backlog of open tickets. Tickets are the primary metric that tracks the amount of work we do for you, and this report shows how efficiently we are managing the workload.
Report Example:
To run a Trouble Tickets: Open vs. Closed report:
Select the Reports tab.
From the Available Reports categories, select Ticket Metrics > Trouble Tickets: Open vs. Closed.
By clicking on the drop-down calendars and selecting a date or by typing over the text in the date field, enter the date range for the report.
Select a summary interval to present in the report.
Click Continue.
NOTE: You will see a message screen that shows the time until the report results
are complete. To exit the results page and send the report to the Stored Reports
page for later viewing, click Send to Stored Reports.
When viewing the report, you will see a graph containing the following information:
For information on different ways to display and/or print report output, see Report Options.
Related topics:
Mean Time to Resolve: Single Event
Mean Time to Resolve: Multiple Events
Trouble Ticket Origination Analysis