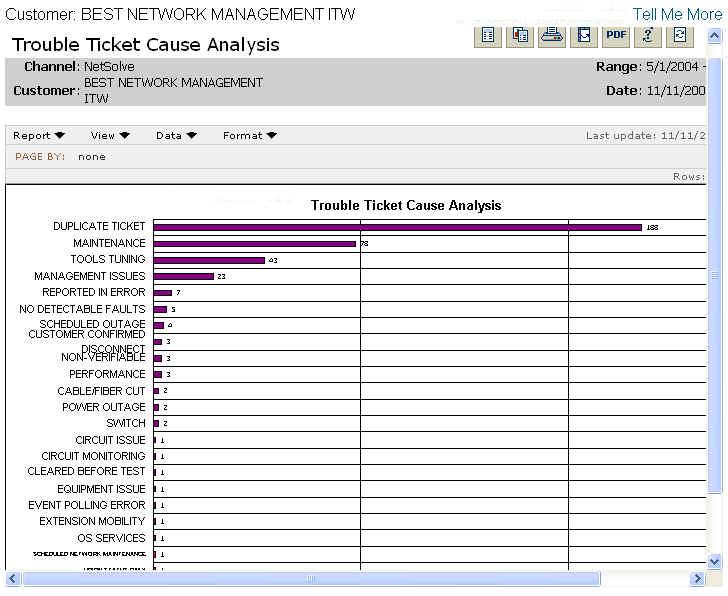
The Trouble Ticket Cause Analysis report sums the causes of trouble tickets over a specified time period and lists the causes ranked by the frequency of occurrence from highest to lowest. This report displays what the most frequent causes of network problems and indicates where resources could be applied to reduce outages.
Report Example:
To run a Trouble Ticket Cause Analysis report:
Select the Reports tab.
From the Available Reports categories, select Ticket Metrics > Trouble Ticket Cause Analysis.
By clicking on the drop-down calendars and selecting a date or by typing over the text in the date field, enter the date range for the report.
Click Continue.
NOTE: You will see a message screen that shows the time until the report results
are complete. To exit the results page and send the report to the Stored Reports
page for later viewing, click Send to Stored Reports.
When viewing the report, you will see a graph containing trouble ticket causes.
For information on different ways to display and/or print report output, see Report Options.
NOTE: The date range covered by the report is shown in the upper right hand corner of the report.
Related topics:
Mean Time to Resolve: Single Event
Mean Time to Resolve: Multiple Events
Trouble Ticket Origination Analysis
Trouble Ticket Volume: Top 10 Sites