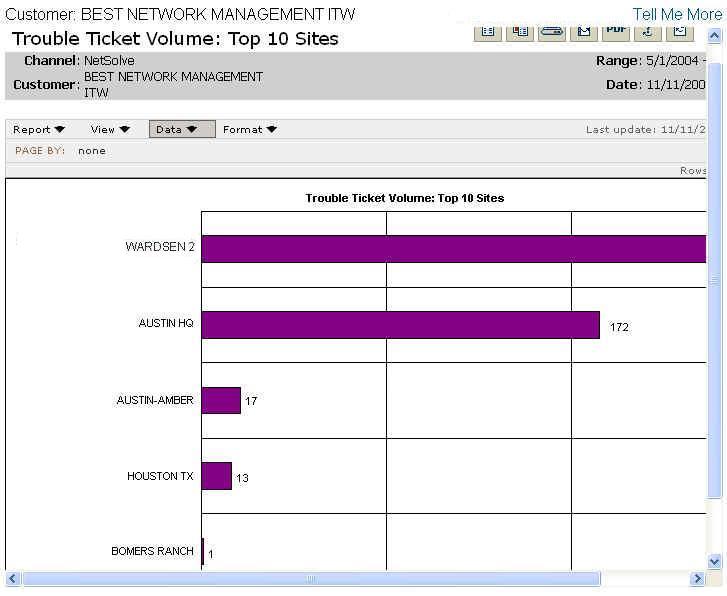
The Trouble Ticket Volume: Top 10 Sites report shows you the most active sites in terms of trouble tickets over the selected time period. You can use this information to see where the hot spots are and where we are applying value.
Report Example:
To run a Trouble Ticket Volume: Top 10 Sites report:
Select the Reports tab.
From the Available Reports categories, select Ticket Metrics > Trouble Ticket Volume: Top 10 Sites.
By clicking on the drop-down calendars and selecting a date or by typing over the text in the date field, enter the date range for the report.
Click Continue.
NOTE: You will see a message screen that shows the time until the report results
are complete. To exit the results page and send the report to the Stored Reports
page for later viewing, click Send to Stored Reports.
When viewing the report, you will see a graph containing information matching the options you selected.
For information on different ways to display and/or print report output, see Report Options.
Related topics:
Mean Time to Resolve: Single Event
Mean Time to Resolve: Multiple Events
Trouble Ticket Origination Analysis
Trouble Tickets: Open vs. Closed